Context
Rasayel is a WhatsApp-first messaging platform for sales and support teams. Before this project, our reporting was unreliable enough that some customers stopped using it entirely or considered churning. Key metrics like first response time and resolution time were hard to trust, and there was no clear audit trail to explain why a number looked wrong.
I led this project as Lead Product and Product Designer: driving discovery, defining the product direction, aligning engineering and leadership, prototyping and implementing the frontend, and closing the loop with customers.
Problems
By 2022, "Reports" had become a liability:
- Customers told us they were churning because of our reports.
- Metrics like FRT and resolution time were inflated by off-hours, follow-ups and messy session logic.
- Teams couldn't drill into raw data or understand how numbers were calculated.
- Agents felt metrics were unfair when conversations moved between people or teams.
Customers are churning because of our reports
Can't trust metrics to run their team fairly
No proper session model for WhatsApp threads
FRT inflated by off-hours and follow-ups
No audit trail or raw data access
Unfair agent attribution
Metrics computed from scattered logs
Important context: WhatsApp conversations don't have a clear beginning or end. Threads can go on for days or weeks. As a consequence, defining when a conversation isn't active is key. For example, if a customer hasn't replied for 3 days, does it still count as one of the conversations the agent handles?
Discovery: Rebuilding the Mental Model
I treated this as a foundational discovery project, not just a UI refresh.
Mining real-world pain
I started by collecting every report-related conversation we'd had with key customers (Marn, Mazeed, Nomod, Alternative Airlines, Jazp). I also reached out to key accounts to plan customer interviews. I tagged and grouped feedback into themes:
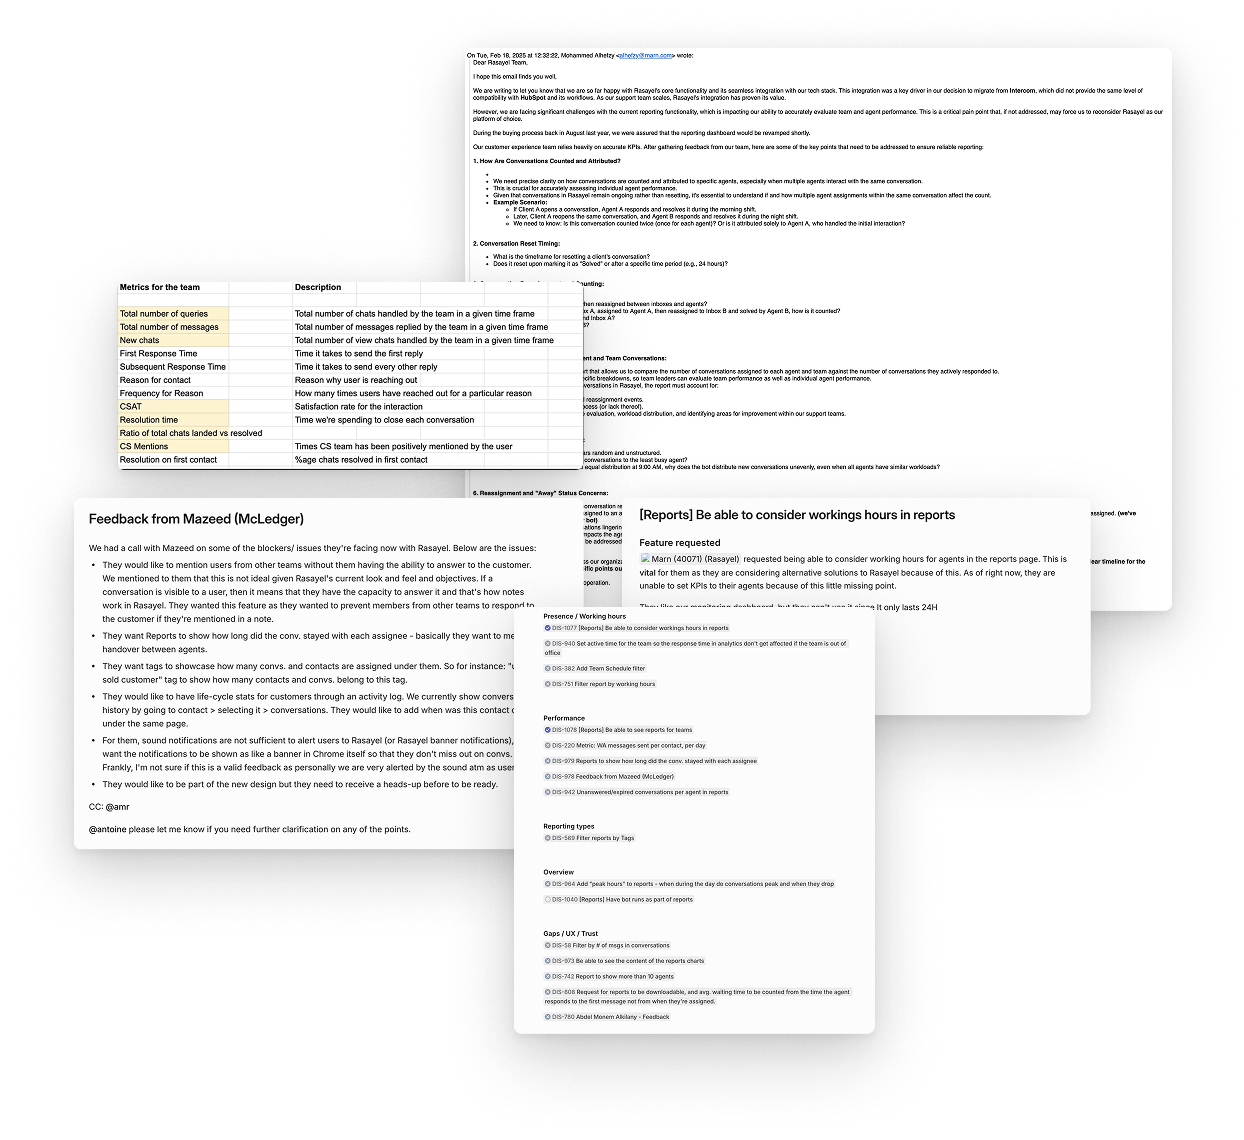
- Data reliability: numbers that didn't match reality, mainly due to bad session boundaries and idle time.
- Missing metrics: gaps that prevented teams from seeing performance clearly.
- Transparency: lack of raw data, unclear metric definitions, and no way to audit.
This gave us a list of very concrete "broken promises":
- "This conversation shows a 2-day resolution, but the customer was asleep for most of that time."
- "We can't tell which agent actually solved the issue."
- "If I export the data and calculate it myself, I get a different number."
Industry research
In parallel, I studied how leading tools like Intercom, Zendesk, and Freshdesk defined sessions, idle time and attribution.
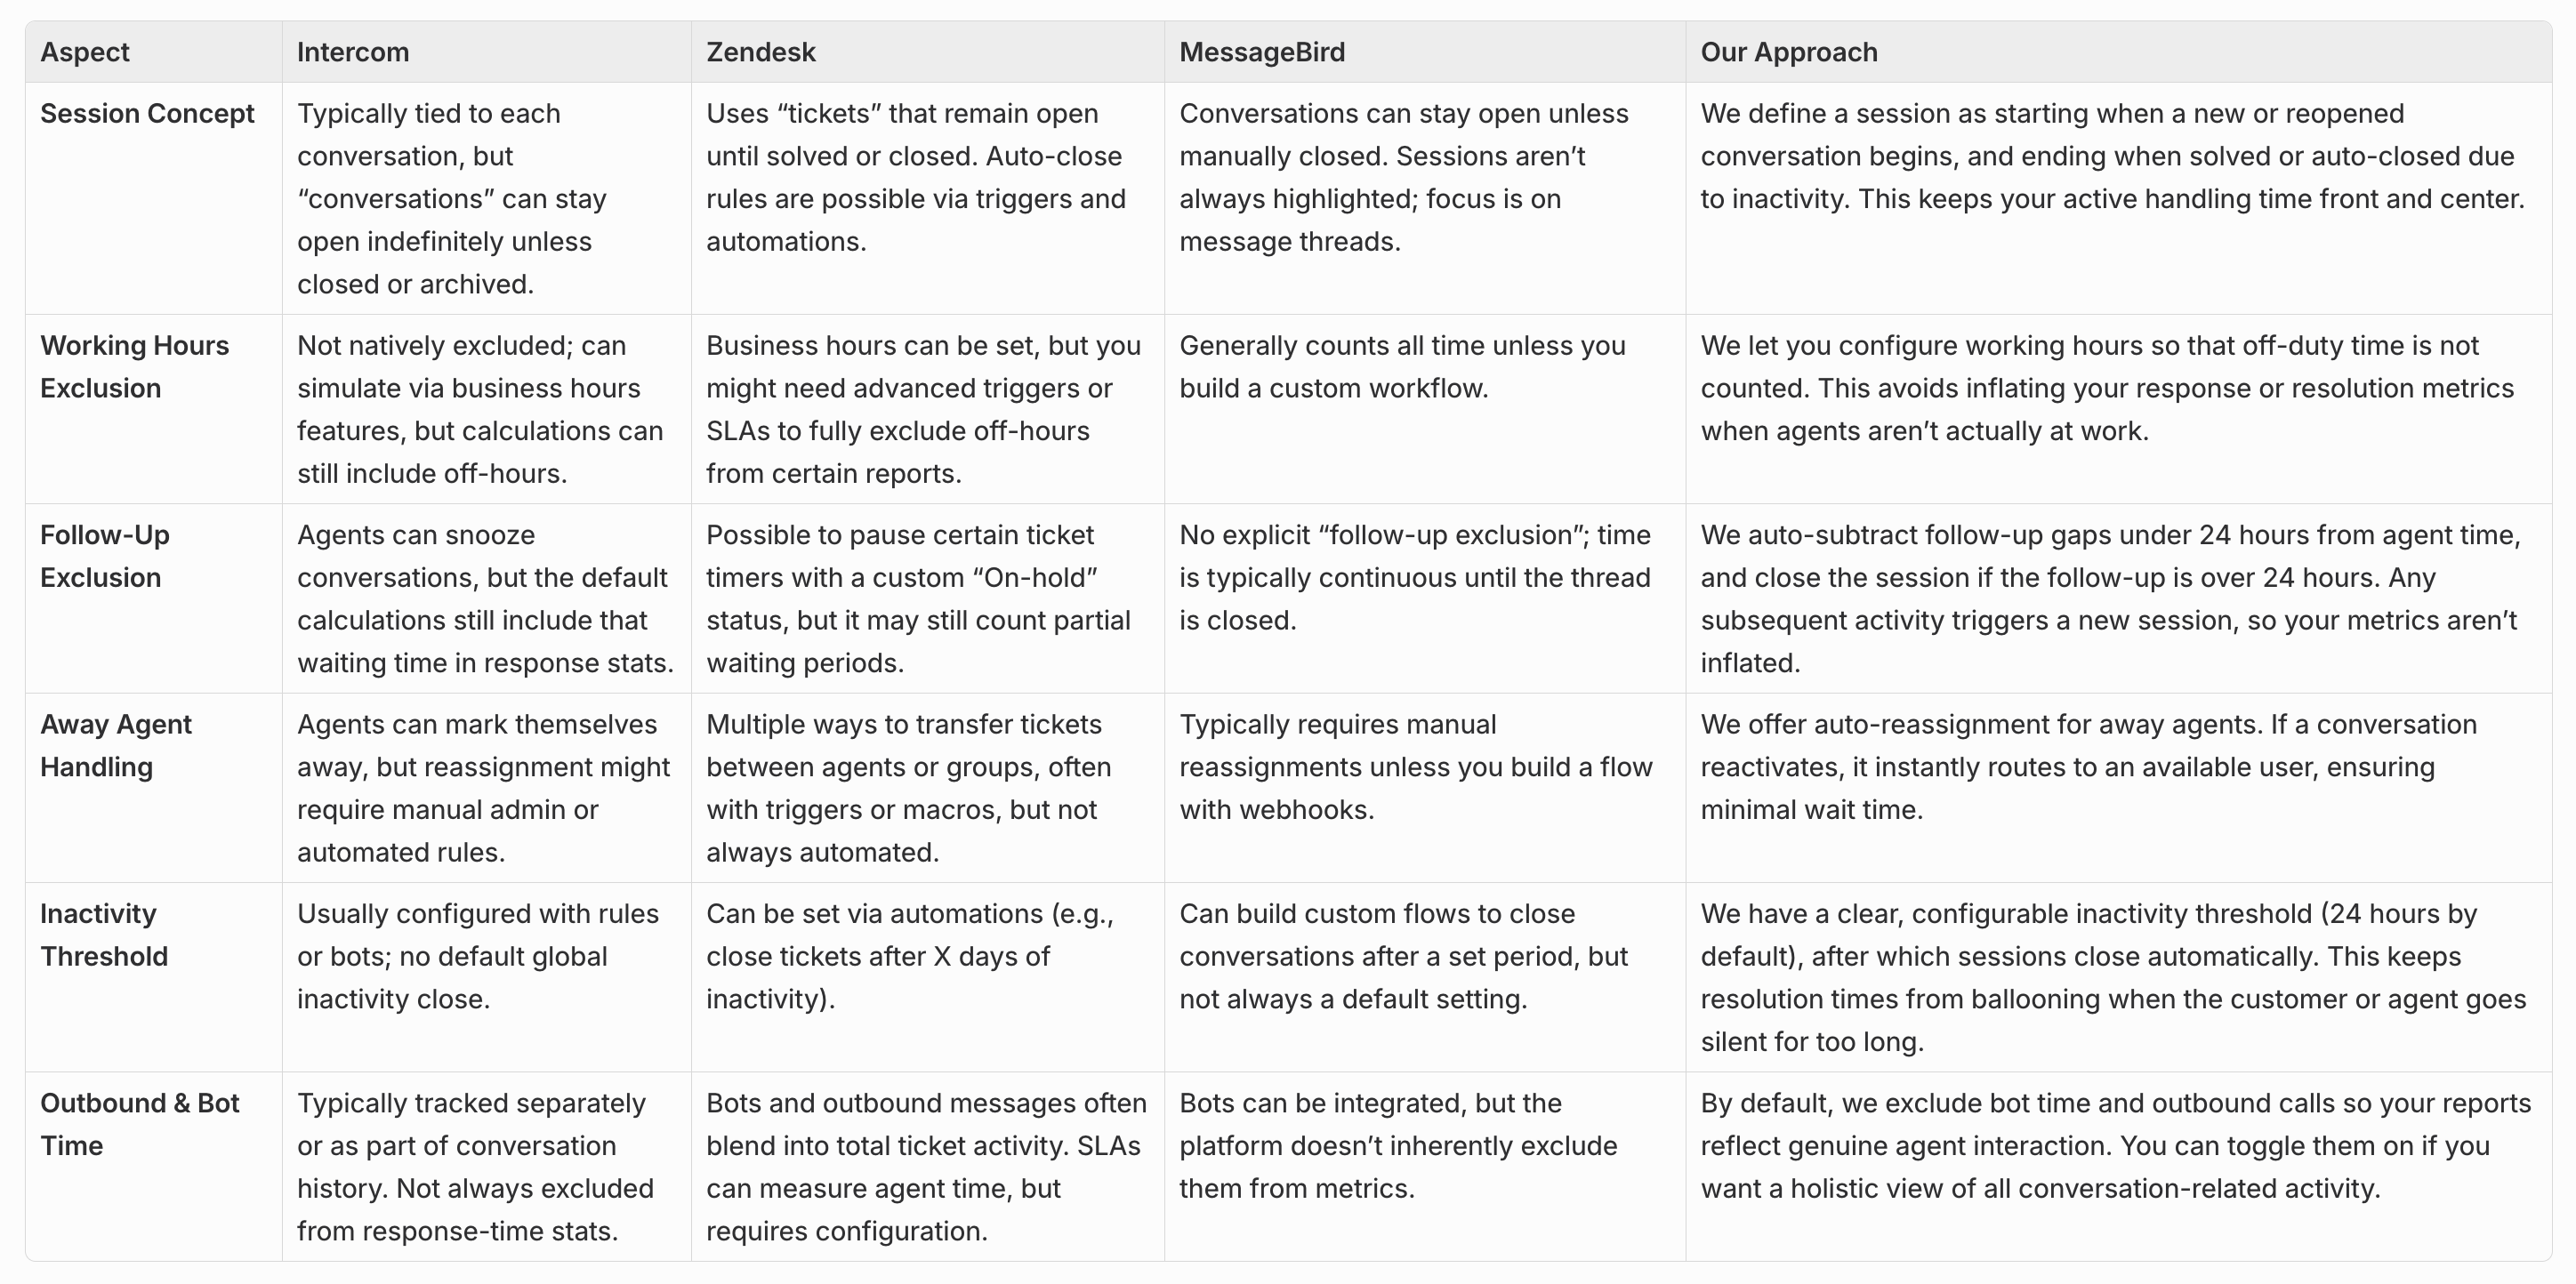
Key takeaways:
- Everyone has some notion of sessions and inactivity windows to keep metrics meaningful — but definitions vary.
- Best practice is to exclude off-hours and long gaps from performance metrics.
- Fair agent attribution is non-negotiable for larger teams.
- Teams want some configurability (e.g. working hours, idle thresholds) rather than one hard-coded definition.
(Re)Framing the Bet
From our discovery sessions, especially calls, we could conclude that the job was ultimately:
"Show me exactly how my team is doing, in a way I can explain and defend—to my agents, my boss and my customers."
With that in mind, we framed a narrow, high-stakes bet:
Hypothesis
If we redesign sessions and time accounting so that core metrics become accurate and auditable, customers will trust and use reports again.
Success Criteria
- Reporting stops being a reason to churn
- Support leaders can explain metrics to their team
- Data matches customers' own calculations
Scope
- Support reporting only (highest pain)
- No regressions for sales reports
- Foundation for future iterations
Scoping
To scope the first iterations, I brought the engineering team together, and we debated different solutions to solve the problems at hand. For a period of 1.5 weeks, we all explored the current system and the solutions to find alignment and challenge each other.
We ended up with the solutions below that we ran by the CEO.
Solutions
Overview
Instead of redesigning charts, we decided to rebuild the mental model and the data model behind reporting.
We focused on six pillars:
- A clear, transparent session model
- Correct handling of idle / off-hours time
- Fair agent attribution
- Access to raw data, filters, and exports
- A solid technical foundation that can be recomputed when rules change
- Auto-reassignment based on presence
We scoped this specifically for support reporting, where the pain was highest, while keeping sales reports working.
1. Sessions, redefined
We defined exactly what a "session" is:
- A session starts when a conversation is created or reopened.
- It ends either when it's manually closed or after a period of inactivity (default 24h, configurable).
Every key metric — first response time, resolution time, handling time — is now computed per session. That makes numbers easier to reason about and, crucially, auditable.
2. Excluding irrelevant time
We excluded time that shouldn't count against agents or teams:
- Non-working hours
- Periods where an agent is marked away
- Long follow-ups (>24h), which are treated as new sessions or removed from "active" time
This alone removed a big source of "these metrics feel unfair" feedback.
3. Accurate attribution
We made attribution rules explicit:
- Last-touch agent gets credit for resolving a session.
- First-touch is still tracked for coaching and fairness.
- Bot/API activity is separated from human time, with an option to include it when needed.
4. Raw data, filters, and exports
To restore trust, we exposed the underlying data:
- Teams can filter by team, agent, tag, date range.
- They can view and export raw conversation and session data for their own analysis or audits.
Instead of arguing with a chart, customers can now click through and see the sessions behind it.
5. Auto-reassignment and presence awareness
We used the same signals to improve operations:
- If an agent is marked away and a new message comes in, the conversation can automatically move to someone available (if enabled).
- Away time is tracked and excluded from metrics so presence settings and performance numbers stay in sync.
6. A new session ledger
Under the hood, we built a session ledger:
- An event-sourced record of each session's lifecycle: messages, reassignments, presence changes, statuses.
- All metrics are derived from this ledger, so if we change business rules later (e.g. idle threshold or working hours), we can recompute history instead of patching queries.
This solved long-standing problems with data drift and missing context.
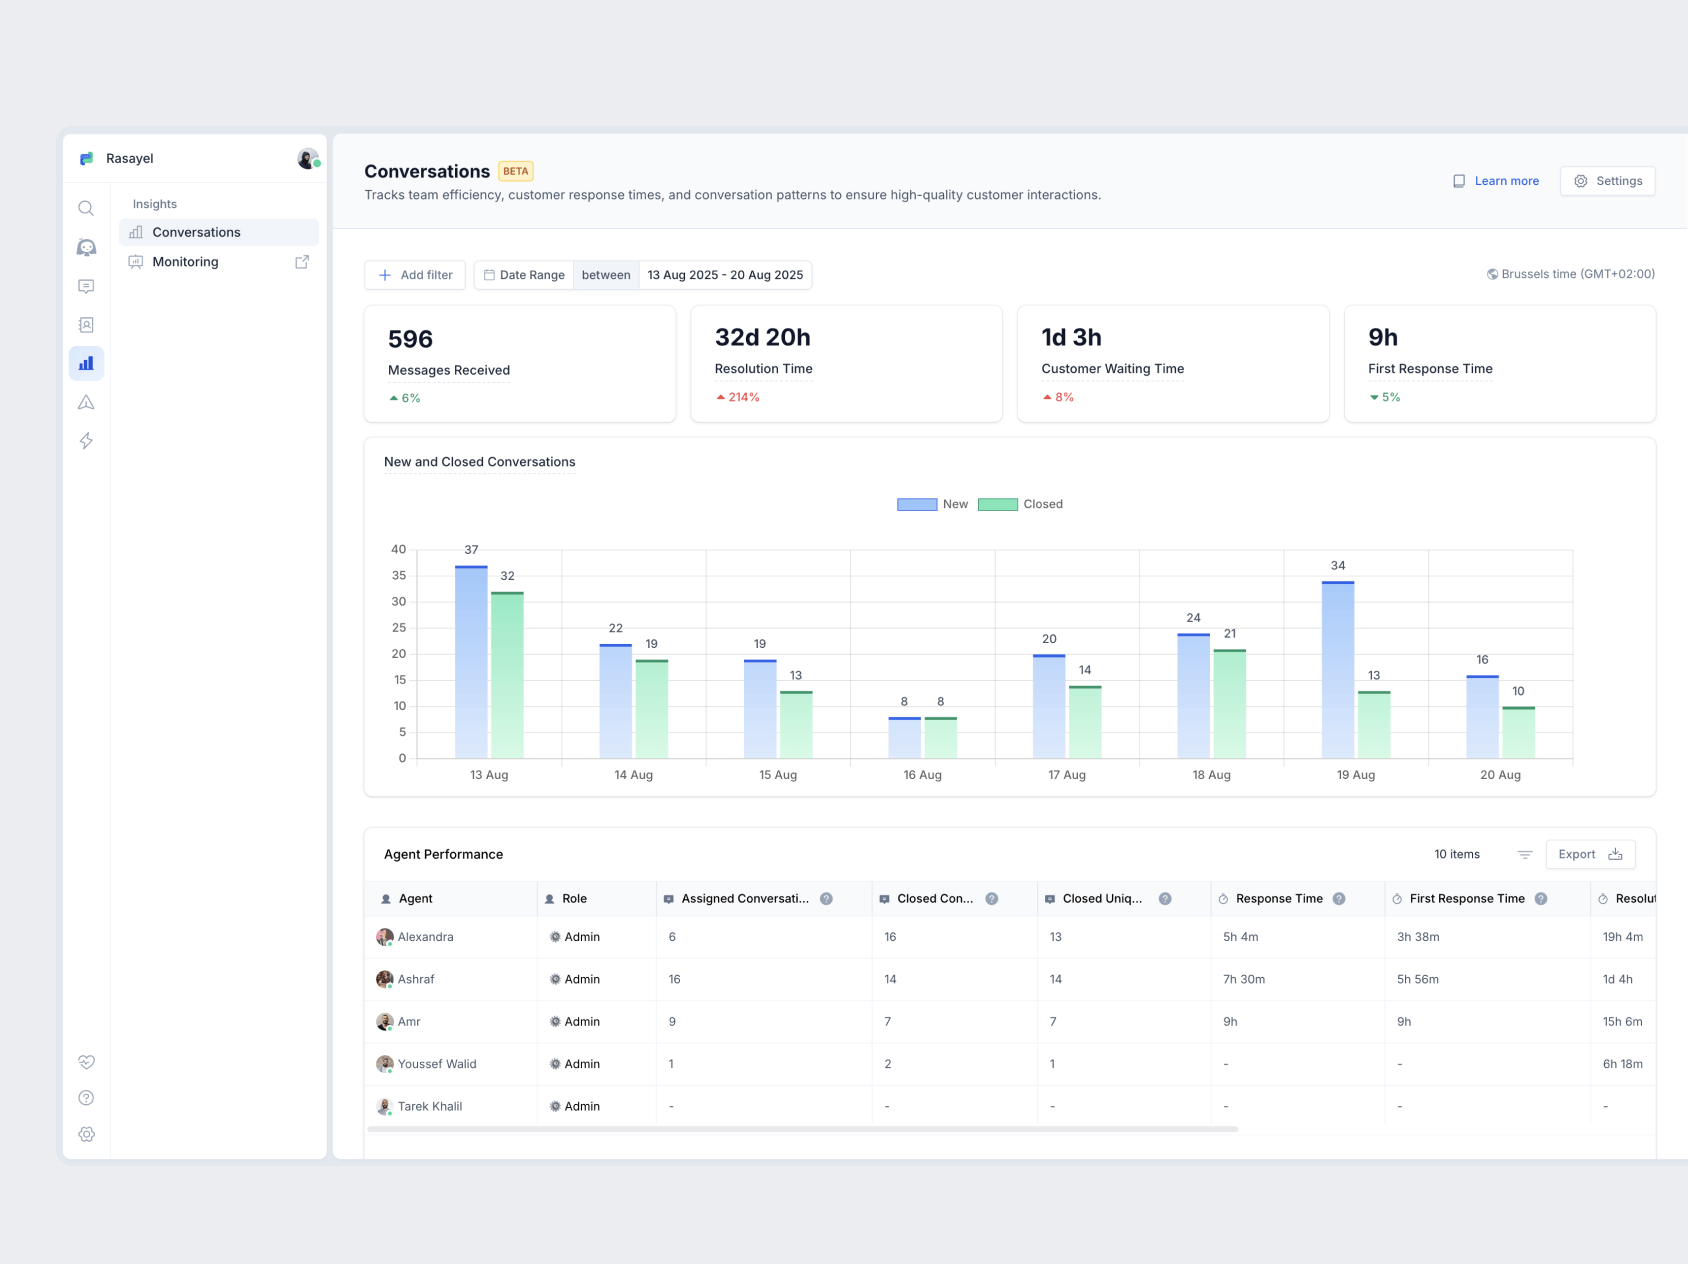
Outcome
The rebuilt reporting transformed from a churn risk into a trusted tool for support leaders.
- Support leaders can now explain and defend their team's metrics to agents and management.
- Customers stopped asking "why doesn't this match my export?" — because now it does.
- The session ledger gave us a foundation for future features like SLA tracking and real-time dashboards.